The Monitoring Dashboard was removed from XperienCentral in version R39.
The XperienCentral Monitoring Dashboard allows you to fully examine many important metrics related to your deployment. The Monitoring Dashboard is configurable which allows you to change thresholds for alerts as well as turn indicator sets on and off in order to customize it to your particular needs.
See also Administrative Pages for metrics that might not be available in the Monitoring Dashboard.
Some of the indicators in the Monitoring Dashboard have configurable thresholds. When a threshold is reached, you see a visual indicator next to the metric. When a warning level is reached, an orange caution indicator is shown and when an error level is reached, a red error indicator is shown:
| Indicator | Meaning |
|---|---|
| Warning |
| Error |
For indicators with a threshold, green is used to show that it is within the configured normal parameters.
Indicator Sets
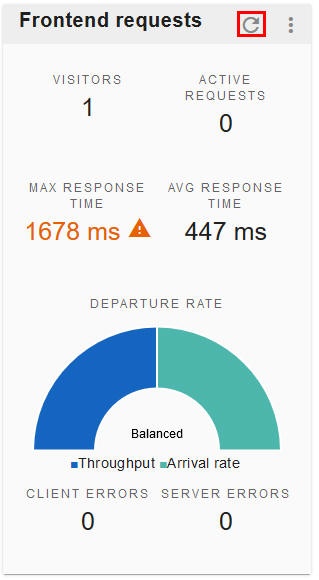
Indicator sets in the Monitoring Dashboard group similar metrics for a specific part of an XperienCentral deployment. The following is an example of an indicator set:

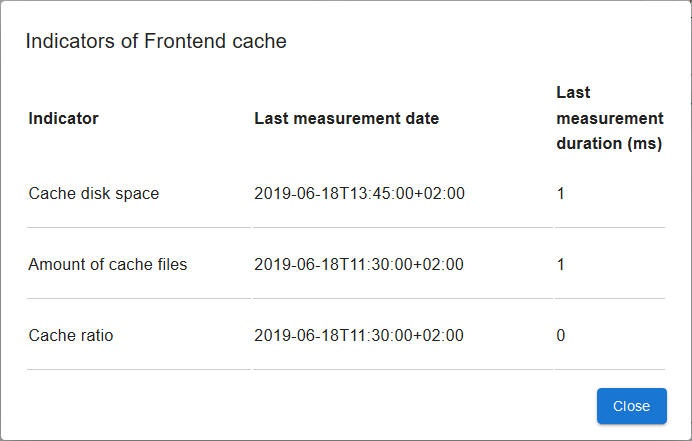
At the upper right corner of each indicator set is a menu icon. When you click the menu icon, you can select "Indicators" to see more detailed information about the time and duration of the measurements taken. For example:
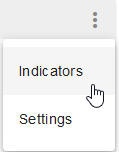
will show:
Refreshing an Indicator Set
To refresh the data in an indicator set, click the Refresh icon:
When you refresh the data in an indicator set, no new metering is performed — the data is simply reloaded. New metering is done according to the Quartz schedule for the indicator set.
To open the Monitoring Dashboard, navigate to Configuration > Monitoring Dashboard.