| Info |
|---|
The Performance Dashboard was removed from XperienCentral in version R28. Use the Administrative Pages instead. |
| Anchor | ||||
|---|---|---|---|---|
|
The status of how the various XperienCentral subsystems are performing is then shown using an easily identifiable color-coded system:
| Performance Indicator | Description |
| The functionality/configuration setting is functioning within optimally expected parameters. |
| The functionality/configuration setting is functioning below its optimal level. |
| The functionality/configuration setting is having a pronounced, negative impact on XperienCentral's performance and should be immediately examined and addressed. |


| Note |
|---|
Notes:
|
To open the Performance Dashboard, navigate to Configuration > Performance Dashboard.
...
For caching, the following indicators related to performance are provided. In the "Status" column, you can click the orange and red indicators for more information on the meaning of the indicator itself and what you can do in order to improve the performance for the related item.
| Indicator | Description |
|---|---|
| Average cache ratio | Indicates the average percentage of all page requests that could be returned from the proxy cache, that is, the number of pages that were returned from the cache divided by the total number of page requests. The average page cache ratio is always a number between 0 and 1 (between 0% and 100%). |
| Timestamp caching | Specifies the timeout in milliseconds that timestamp caching is currently set to. |
| Caching enabled | Specifies whether caching is enabled or disabled. The caching module of XperienCentral caches the web pages of the website. When a page is first requested, the web page is generated and stored in this cache. All subsequent requests for this page will be returned from the cache - this prevents the page from being generated each time it is requested. Web pages stay cached until the content is modified. The performance of a website is directly affected by the caching setting: If disabled, website visitors will experience much slower response times. |
Response Time
For response times, the following indicators related to performance are shown. In the "Status" column, you can click the orange and red indicators for more information on the meaning of the indicator itself and what you can do in order to improve the performance for the related item.The values listed are those that have been measured since the last time the list was cleared.
...
To enable monitoring for web pages and/or pages generated by the Page Generator pages, select "Monitoring enabled".
| Note | ||||
|---|---|---|---|---|
| :||||
|
...
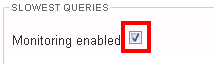
Use the Queries tab to monitor and examine the queries that have taken the most time (the slowest). To enable query monitoring, select "Monitoring enabled":
| Note | ||||
|---|---|---|---|---|
| :||||
|
...
This section describes the reason(s) that a system indicator may display a status of orange or red and the steps you can take to investigate the matter and change your XperienCentral settings in order to improve your website's performance.
Caching
If caching is enabled in XperienCentral, a green indicator is shown and if it is disabled, a red indicator is shown. Caching allows XperienCentral to handle the load created by many page requests by using an intelligent mechanism that returns pages without having to regenerate them completely every time they are requested. In all cases, caching improves website performance and it is highly recommended that you enable it for your website.
To enable/disable caching, navigate to the Setup Tool. On the General tab, navigate to the "frontend_system_settings" section and select allow_cache:
...
The caching module of XperienCentral stores a timestamp in the timestamp database for each cached web page. This timestamp is needed in order to determine whether the web page needs to be regenerated or whether it can be retrieved from the cache. For high volume websites, the number of web page requests per second can be so high that even the relatively simple task of performing one SQL query to retrieve this timestamp from the database can cause a bottleneck. If this exceeds 500 milliseconds, it may indicate a performance issue.
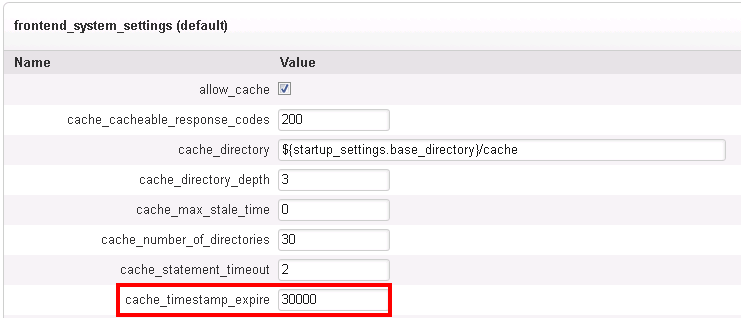
To prevent timestamp retrieval from becoming a bottleneck, timestamps can be cached in memory for <n> milliseconds. Note that this also causes a delay of <n> milliseconds; during the <n> milliseconds, modified web pages will not be regenerated. It is recommended that you set timestamp caching to at least 5000 milliseconds (5 seconds). If you set timestamp caching to fewer than 5000 milliseconds, this can cause database bottlenecks especially for websites that experience a large number of page requests.
Timestamp caching is configured in the XperienCentral Setup Tool. Navigate to the "frontend_system_settings" section of the General (R30 and older) tab:
| Anchor | ||||
|---|---|---|---|---|
|
Page response time performance for pages returned from the cache as well as pages generated by the Page Generator is measured in the following way:
Indicator | Value |
|
|
|
|---|---|---|---|---|
| Largest page response time | milliseconds | Less than or equal to 1000 | Between 1000 and 4999 | 5000+ |
| Average response time | milliseconds | 0-99 | 101-499 | 500+ |
Large Response Times for Individual Pages
...
Query execution time is measured in the following way:
Indicator | Value |
|
|
|
|---|---|---|---|---|
| Slowest Queries | milliseconds | 500 | Between 500 and 2000 | 2000+ |
Query execution time that exceeds 500 milliseconds may indicate a performance issue. The list of the slowest queries contains both internal XperienCentral queries as well as queries that have been developed especially for your web site. If a query that you have developed is especially slow compared to other queries or is consistently slow, you might want to examine it carefully to see whether it is possible to restructure it for greater efficiency.
...
Average query response time is measured in the following way:
Indicator | Value |
|
|
|
|---|---|---|---|---|
| Average query execution time | milliseconds | 0-500 | 501-1999 | 2000+ |
...
If the average query execution time is higher than 501 milliseconds, it could indicate a fundamental problem with the performance of the database that XperienCentral is using. If other applications are using the same database as XperienCentral, this can cause the average query execution time to increase. If you consistently experience high average query execution times, you should investigate how the database you are using for XperienCentral is configured and whether it is functioning correctly/optimally.
...
The average cache ratio is measured in the following way:
Indicator | Value |
|
|
|
|---|---|---|---|---|
| Average cache ratio | percent | 10+ | between 1 and 9 | less than 1 |
...
A cache ratio that is less than 10 indicates that XperienCentral is having to generate a large number of pages instead of retrieving them from the cache. This can be because:
...
The XperienCentral debug options are useful during the website development phase but should not be enabled on a live website because they can slow down performance. The possible statuses of the debug option in the dashboard are:
Indicator |
|
|
|---|---|---|
| Debug options | All debug options are disabled. | One or more debug options is enabled. |
...
To enable/disable the XperienCentral debug options that affect performance, navigate to the Setup Tool. On the General (R30 and older) tab, navigate to "development_settings". Clear the checkbox for enable_debug_messages. In a production environment, the setting enable_view_resolve_cache should be selected.
...
The level at which you log messages has a direct effect on system performance. Each time a system event is logged, a small performance hit occurs. Logging messages of type SEVERE affects the system the least whereas logging at the INFO level can cause the system to slow down due to the sheer volume of messages that are written to the log. The effect that the logging level has on XperienCentral performance is indicated as follows.
Indicator |
|
|
|
|---|---|---|---|
| Log level | SEVERE | WARNING | INFO |
To change the log level, follow these steps:
...
For more information on logging events in XperienCentral, see the Log administrative page.
...
Creating Custom Performance Indicator Tabs
...