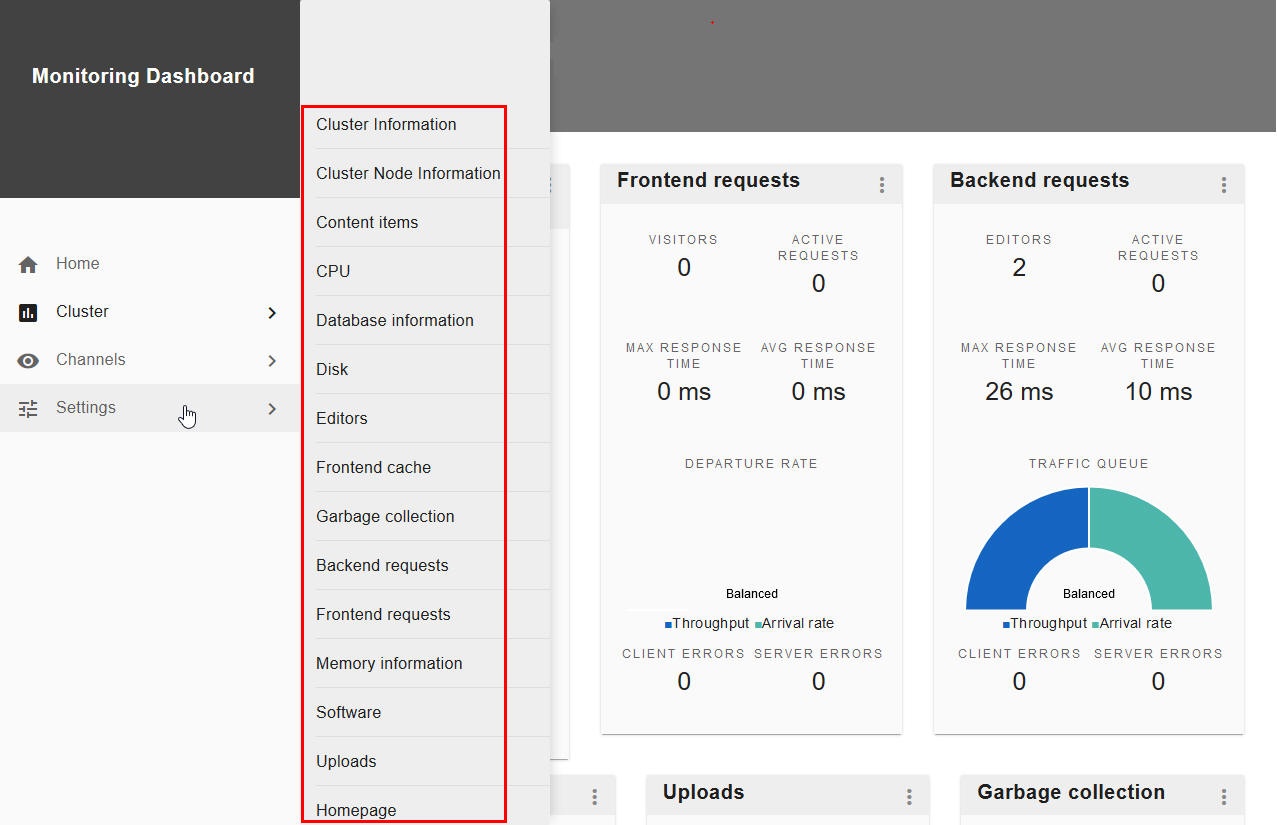
In Settings, you can configure the conditions under which the Monitoring Dashboard issues warning and error alerts as well as modify other settings. When you expand "Settings" in the menu, you can select the indicator set you want to modify. For example:
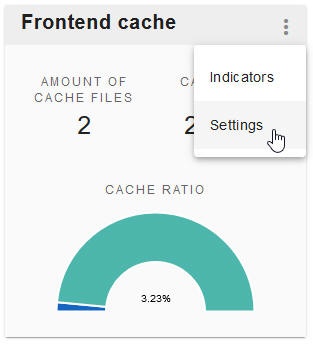
You can also navigate to the settings for an indicator set by clicking the menu icon in the upper right corner of an indicator set and selecting "Settings". For example:
Enabling/Disabling Indicator Sets
To enable/disable an indicator set, move the slider to the left to disable a set and move it to the right to enable it:

If an indicator is configurable, select "Overrule default" to modify it:

|
|---|
| Indicator | Description | Default |
| Warning threshold difference in JCR revision | Specifies how many version differences between the JCR on the server and the latest released version will trigger a warning (orange). | 2 |
| Error threshold difference in JCR revision | Specifies how many version differences between the JCR on the server and the latest released version will trigger an error (red). | 5 |
| Warning threshold difference in number of items in SOLR index | Specifies the threshold of the difference between the largest and smallest value of the "Number of pages" count in the SOLR index that will trigger a warning (orange). The "Number of pages" value can be found in the Search Tools tab of the Setup Tool under "Server Status". | 10 |
| Error threshold difference in number of items in SOLR index | Specifies the threshold of the difference between the largest and smallest value of the "Number of pages" count in the SOLR index that will trigger an error (red). The "Number of pages" value can be found in the Search Tools tab of the Setup Tool under "Server Status". | 50 |
|
|---|
| Indicator | Description | Default |
| Warning Threshold for the amount of processors/cores | Specifies the threshold for the lowest number of processors that will trigger a warning (orange). | 2 |
| Error threshold for the amount of processors/cores | Specifies the threshold for the lowest number of processors that will trigger an error (red). | 1 |
| Warning threshold for the amount of heap memory assigned to the JVM | Specifies the threshold for the highest amount of heap memory, in MB, assigned to the JVM that will trigger a warning (orange). | 1280 |
| Error threshold for the amount of heap memory assigned to the JVM | Specifies the threshold for the highest amount of heap memory, in MB, assigned to the JVM that will trigger an error (red). | 1792 |
Content Items |
|---|
| Indicator | Description |
| Quartz schedule for the measurement task | Specifies when the task that measures the indicators in this set will run. See Quartz documentation. |
CPU |
|---|
| Indicator | Description | Default |
| Warning threshold for the amount of active threads | Specifies the number of active threads that will trigger a warning (orange). | 200 |
| Error threshold for the amount of active threads | Specifies the number of active threads that will trigger an error (red). | 300 |
| Warning threshold for the total percentage of CPU usage | Specifies the percentage of total CPU usage that will trigger a warning (orange). | 90 |
| Error threshold for the total percentage of CPU usage | Specifies the percentage of total CPU usage that will trigger an error (red). | 95 |
| Warning threshold for the percentage of CPU usage of the current process (the JVM) | Specifies the percentage of CPU usage by the JVM that will trigger a warning (orange). | 70 |
| Error threshold for the percentage of CPU usage of the current process (the JVM) | Specifies the percentage of CPU usage by the JVM that will trigger an error (red). | 85 |
|
|---|
| Indicator | Description |
| Quartz schedule for the measurement task | Specifies when the task that measures the indicators in this set will run. See Quartz documentation. |
Disk |
|---|
| Indicator | Description | Default |
| Warning threshold for the amount of free disk space (in MB) | Specifies the threshold for the lowest amount of free disk space, in MB, that will trigger a warning (orange). | 1024 |
| Error threshold for the amount of free disk space (in MB) | Specifies the threshold for the lowest amount of free disk space, in MB, that will trigger an error (red). | 512 |
Editors |
|---|
| Indicator | Description | Default |
| Quartz schedule for the measurement task | Specifies when the task that measures the indicators in this set will run. See Quartz documentation. | n/a |
| Amount of days for recently logged in | Specifies the number of days within which an editor has logged in to XperienCentral in order to be considered "recently logged in". | 30 |
Frontend Cache |
|---|
| Indicator | Description |
| Quartz schedule for the measurement task | Specifies when the task that measures the indicators in this set will run. See Quartz documentation. |
Garbage Collection |
|---|
| Indicator | Description | Default |
| Warning threshold memory cleared by minor garbage collection | Specifies the threshold for the amount of memory, in MB, cleared by minor garbage collection that will trigger a warning (orange). | 51200 |
| Error threshold memory cleared by minor garbage collection | Specifies the threshold for the amount of memory, in MB, cleared by minor garbage collection that will trigger an error (red). | 10240 |
| Warning threshold memory cleared by major garbage collection | Specifies the threshold for the amount of memory, in MB, cleared by major garbage collection that will trigger a warning (orange). | 204800 |
| Error threshold memory cleared by major garbage collection | Specifies the threshold for the amount of memory, in MB, cleared by major garbage collection that will trigger an error (red). | 51200 |
Backend Requests |
|---|
| Indicator | Description | Default |
| Warning threshold amount of active requests | Specifies the threshold of the number of active backend requests that will trigger a warning (orange). | 75 |
| Error threshold amount of active requests | Specifies the threshold of the number of active baclend requests that will trigger an error (red). | 150 |
| Warning threshold average response time | Specifies the threshold, in milliseconds, of the average response time for backend requests that will trigger a warning (orange). | 1000 |
| Error threshold average response time | Specifies the threshold, in milliseconds, of the average response time for backend requests that will trigger an error (red). | 3000 |
| Warning threshold amount of client errors per minute | Specifies the threshold of the number of 4xx (client) responses on the backend per minute that will trigger a warning (orange). | 1 |
| Error threshold amount of client errors per minute | Specifies the threshold of the number of 4xx (client) responses on the backend per minute that will trigger an error (red). | 3 |
| Warning threshold amount of server errors per minute | Specifies the threshold of the number of 5xx (server) responses on the backend per minute that will trigger a warning (orange). | 0.2 |
| Error threshold amount of server errors per minute | Specifies the threshold of the number of 5xx (server) responses on the backend per minute that will trigger an error (red). | 0.5 |
| Quartz schedule for the measurement task | Specifies when the task that measures the indicators in this set will run. See Quartz documentation. | n/a |
| Average measure interval (in seconds) | Specifies the average number of seconds in which to perform indicator measurements. | 120 |
| Editors measure interval (in seconds) | Specifies the number of seconds to use when performing indicator measurements related to editors. | 300 |
| Client and server errors interval (in minutes) | Specifies the number of minutes to use when performing indicator measurements related to backend client/server errors. | 1440 |
Frontend Requests |
|---|
| Indicator | Description | Default |
| Warning threshold amount of active requests | Specifies the threshold of the number of active frontend requests that will trigger a warning (orange). | 75 |
| Error threshold amount of active requests | Specifies the threshold of the number of active frontend requests that will trigger an error (red). | 150 |
| Warning threshold average response time | Specifies the threshold, in milliseconds, of the average response time for frontend requests that will trigger a warning (orange). | 1000 |
| Error threshold average response time | Specifies the threshold, in milliseconds, of the average response time for frontend requests that will trigger an error (red). | 3000 |
| Warning threshold amount of client errors per minute | Specifies the threshold of the number of 4xx (client) responses on the frontend per minute that will trigger a warning (orange). | 1 |
| Warning threshold amount of client errors per minute | Specifies the threshold of the number of 4xx (client) responses on the frontend per minute that will trigger an error (red). | 3 |
| Warning threshold amount of server errors per minute | Specifies the threshold of the number of 5xx (server) responses on the frontend per minute that will trigger a warning (orange). | 0.2 |
| Error threshold amount of server errors per minute | Specifies the threshold of the number of 5xx (server) responses on the frontend per minute that will trigger an error (red). | 0.5 |
| Quartz schedule for the measurement task | Specifies when the task that measures the indicators in this set will run. See Quartz documentation. | n/a |
| Average measure interval (in seconds) | Specifies the average number of seconds in which to perform indicator measurements. | 120 |
| Visitors measure interval (in seconds) | Specifies the number of seconds to use when performing indicator measurements related to visitors. | 300 |
| Client and server errors interval (in minutes) | Specifies the number of minutes to use when performing indicator measurements related to frontend client/server errors. | 1440 |
|
|---|
| Indicator | Description | Default |
| Warning threshold for installed RAM | Specifies the threshold for the lowest amount of installed RAM, in MB, that will trigger a warning (orange). | 3072 |
| Error threshold for installed RAM | Specifies the threshold for the lowest amount of installed RAM, in MB, that will trigger an error (red). | 1536 |
| Warning threshold for heap memory allocated to the JVM | Specifies the threshold for the amount of heap memory allocated to the JVM that will trigger a warning (orange). | 1792 |
| Error threshold for heap memory allocated to the JVM | Specifies the threshold for the amount of heap memory allocated to the JVM that will trigger an error (red). | 1280 |
| Warning threshold for used heap space/committed heap space (in %) | Specifies the threshold for the percentage of used heap space compared to amount of committed heap space that will trigger a warning (orange). | 90 |
| Error threshold for used heap space/committed heap space (in %) | Specifies the threshold for the percentage of used heap space compared to amount of committed heap space that will trigger an error (red). | 95 |
| Quartz schedule for the measurement task | Specifies when the task that measures the indicators in this set will run. See Quartz documentation. | n/a |
Software |
|---|
| Indicator | Description | Default |
| Minimum Java version alert threshold | Specifies the minimum version of Java that will trigger an alert (1.8.0_190 for example). | varies |
| Minimum Java version error threshold | Specifies the minimum version of Java that will trigger an error (1.8.0_190 for example). | varies |
| Error threshold for maximum Java version | Specifies the maximum version of Java that will trigger an error (11.0.0 for example). | varies |
| Minimum Tomcat version error threshold | Specifies the minimum version of Tomcat that will trigger an error (7.0.0 for example). | varies |
| Minimum Tomcat version alert threshold | Specifies the minimum version of Tomcat that will trigger an alert (8.5.0 for example). | varies |
| Error threshold for maximum Tomcat version | Specifies the maximum version of Tomcat that will trigger an error (9.0.0 for example). | varies |
| Minimum JBoss version error threshold | Specifies the minimum version of JBoss that will trigger an error (7.5.0 for example). | varies |
| Minimum JBoss version alert threshold | Specifies the minimum version of JBoss that will trigger an alert (7.5.0 for example). | varies |
| Maximum JBoss version error threshold | Specifies the maximum version of JBoss that will trigger an error (7.6.0 for example). | varies |
| Quartz schedule for the measurement task | Specifies when the task that measures the indicators in this set will run. See Quartz documentation. | n/a |
Uploads |
|---|
| Indicator | Description |
| Quartz schedule for the measurement task | Specifies when the task that measures the indicators in this set will run. See Quartz documentation. |
Homepage |
|---|
| Indicator | Description | Default |
| Alert threshold response time | Specifies the response time alert threshold, in milliseconds, for homepage requests. | 2000 |
| Error threshold response time | Specifies the response time error threshold, in milliseconds, for homepage requests. | 5000 |
| Quartz schedule for the measurement task | Specifies when the task that measures the indicators in this set will run. See Quartz documentation. | n/a |