The XperienCentral Performance Dashboard provides detailed information about how the parts of XperienCentral's infrastructure are functioning. Because XperienCentral is a complex system, the interaction between many different sub-systems and configuration options has a direct impact on how it performs. Using the Performance Dashboard, system administrators, developers, and application managers can quickly identify problems and then make the necessary configuration changes to ensure that XperienCentral performs optimally. The Performance Dashboard measures the speed and response time of page requests and internal queries as well as other settings that affect how XperienCentral runs and rates the results according to the optimal expected results.
The status of how the various XperienCentral subsystems are performing is then shown using an easily identifiable color-coded system:
| Indicator | Description |
| The functionality/configuration setting is functioning within optimally expected parameters. |
| The functionality/configuration setting is functioning below its optimal level. |
| The functionality/configuration setting is having a pronounced, negative impact on XperienCentral's performance and should be immediately examined and addressed. |


Notes:
- In a clustered environment, the statistics shown in the Performance Dashboard are only for the node/instance/server on which the Performance Dashboard is running, not the whole environment.
- The Administrative Pages are also useful for closely examining the performance of processes and events within XperienCentral.
In This Topic
System Performance Indicators
The System Performance Indicators tab shows performance information related to web page caching, web page response times, and the effect that important configuration settings are having on the overall performance of XperienCentral.
Caching
For caching, the following indicators related to performance are provided. In the "Status" column, you can click the orange and red indicators for more information on the meaning of the indicator itself and what you can do in order to improve the performance for the related item.
| Indicator | Description |
|---|---|
| Average cache ratio | Indicates the average percentage of all page requests that could be returned from the proxy cache, that is, the number of pages that were returned from the cache divided by the total number of page requests. The average page cache ratio is always a number between 0 and 1 (between 0% and 100%). |
| Timestamp caching | Specifies the timeout in milliseconds that timestamp caching is currently set to. |
| Caching enabled | Specifies whether caching is enabled or disabled. The caching module of XperienCentral caches the web pages of the website. When a page is first requested, the web page is generated and stored in this cache. All subsequent requests for this page will be returned from the cache - this prevents the page from being generated each time it is requested. Web pages stay cached until the content is modified. The performance of a website is directly affected by the caching setting: If disabled, website visitors will experience much slower response times. |
Response Time
For response times, the following indicators related to performance are shown. In the "Status" column, you can click the orange and red indicators for more information on the meaning of the indicator itself and what you can do in order to improve the performance for the related item.The values listed are those that have been measured since the last time the list was cleared.
| Indicator | Description |
|---|---|
| Largest response time | The largest response time in milliseconds for all page requests across the entire web site. To view the response time for individual pages, see the Page response time tab. |
| Largest query execution time | The largest query execution time is the execution time of the longest of all SQL queries performed on all databases. To view the query execution time for individual queries, see the Queries tab. |
| Largest response time Page Generator | The largest response time in milliseconds the Page Generator took to fulfill a request. To view the Page Generator response time for individual pages, see the Page response time tab. |
| Average response time Page Generator | The average response time in milliseconds that the Page Generator took to fulfill requests. To view the Page Generator response time for individual pages, see the Page response time tab. |
| Average response time | The average response time in milliseconds for all page requests.To view the response time for individual pages, see the Page response time tab. |
| Average query execution time | The average query response time is the average for all SQL queries performed on all databases. To view the query execution time for individual queries, see the Queries tab. |
Settings
The settings tab shows the status of XperienCentral settings that can affect performance. In the "Status" column, you can click the orange and red indicators for more information on the meaning of the indicator itself and what you can do in order to improve the performance for the related item.
| Indicator | Description |
|---|---|
| Debugging options | Specifies the status of the XperienCentral debug options. If any debug option is enabled, the status is red. |
| Log level | Specifies the level of logging that is currently set for XperienCentral. Logging can be enabled for the following system functionality:
|
Page Response Time Indicators
The Page response tab shows a list of the slowest page response times in milliseconds for pages requested from the website. The page response tab lists two different types of pages:
- The slowest pages requested by website visitors that were not retrieved from the cache but had to be generated by the Page Generator
- The overall slowest pages requested by website visitors, both those returned from the cache as well as those generated by the Page Generator
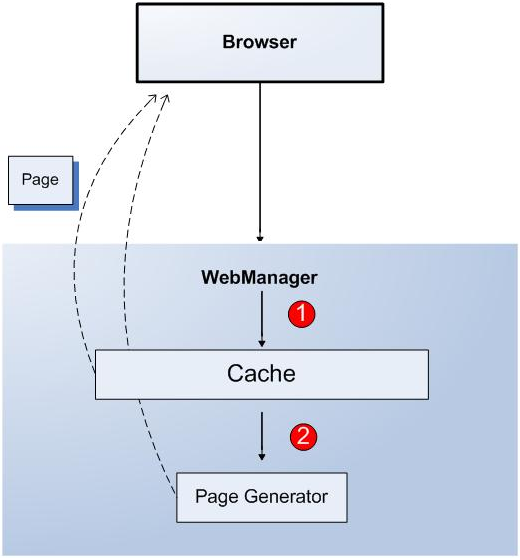
If caching is enabled, when a page is requested, XperienCentral determines whether the page can be returned from the cache (see 1 in the figure below) and returns it; if the page cannot be returned from the cache, it is generated by the Page Generator and returned (see 2 in the figure below):
To enable monitoring for web pages and/or pages generated by the Page Generator pages, select "Monitoring enabled".
Notes:
- These options are not persisted - Monitoring is enabled for the current session only. If the Tomcat server is restarted, these checkboxes are cleared.
- Enabling page response time monitoring can affect XperienCentral performance. Monitoring should not be constantly enabled.
When these monitoring settings are enabled, the pages returned by the Page Generator that took the longest to generate as well as the pages that took the longest time to load are listed. The pages that appear in the list are those that have been read since monitoring was enabled or since the last time that the list was cleared using the [Clear list] button.
Slowest Pages from the Page Generator
The pages listed in the "Slowest Pages from the Page Generator" list are pages requested from the website that were generated by the Page Generator and not taken from the cache. The pages in this list are a subset of the pages in the "Slowest pages" list and will always appear in the "Slowest Pages" list as well. See the section Lowering Page Response Times for troubleshooting information.
Slowest Pages
The pages listed in the "Slowest Pages" list are the pages requested from the website that took the longest time to load from the cache and/or be generated by the Page Generator. The pages that took the longest time to be generated by the Page Generator are also listed separately in the "Slowest Pages Page Generator" list. See the section Lowering Page Response Times for troubleshooting information.
To view the contents of a page in the list in a separate window, click its URL in the list. This makes it easy for you to quickly view the contents of the slowest pages. The page will display in a separate window.
Note: Not all pages in the list are viewable due to context-related factors. If the page cannot be displayed, a JavaScript error will be returned.
To refresh the list, click [Refresh this page]. To clear the list, click [Clear list]. For information about steps you can take to improve the performance of slow pages, see the section Lowering page response times.